
PRODUCTS / FOOD, GRAIN & BAKING / FLOUR & DOUGH
JenoGraph flour &
dough testing instrument
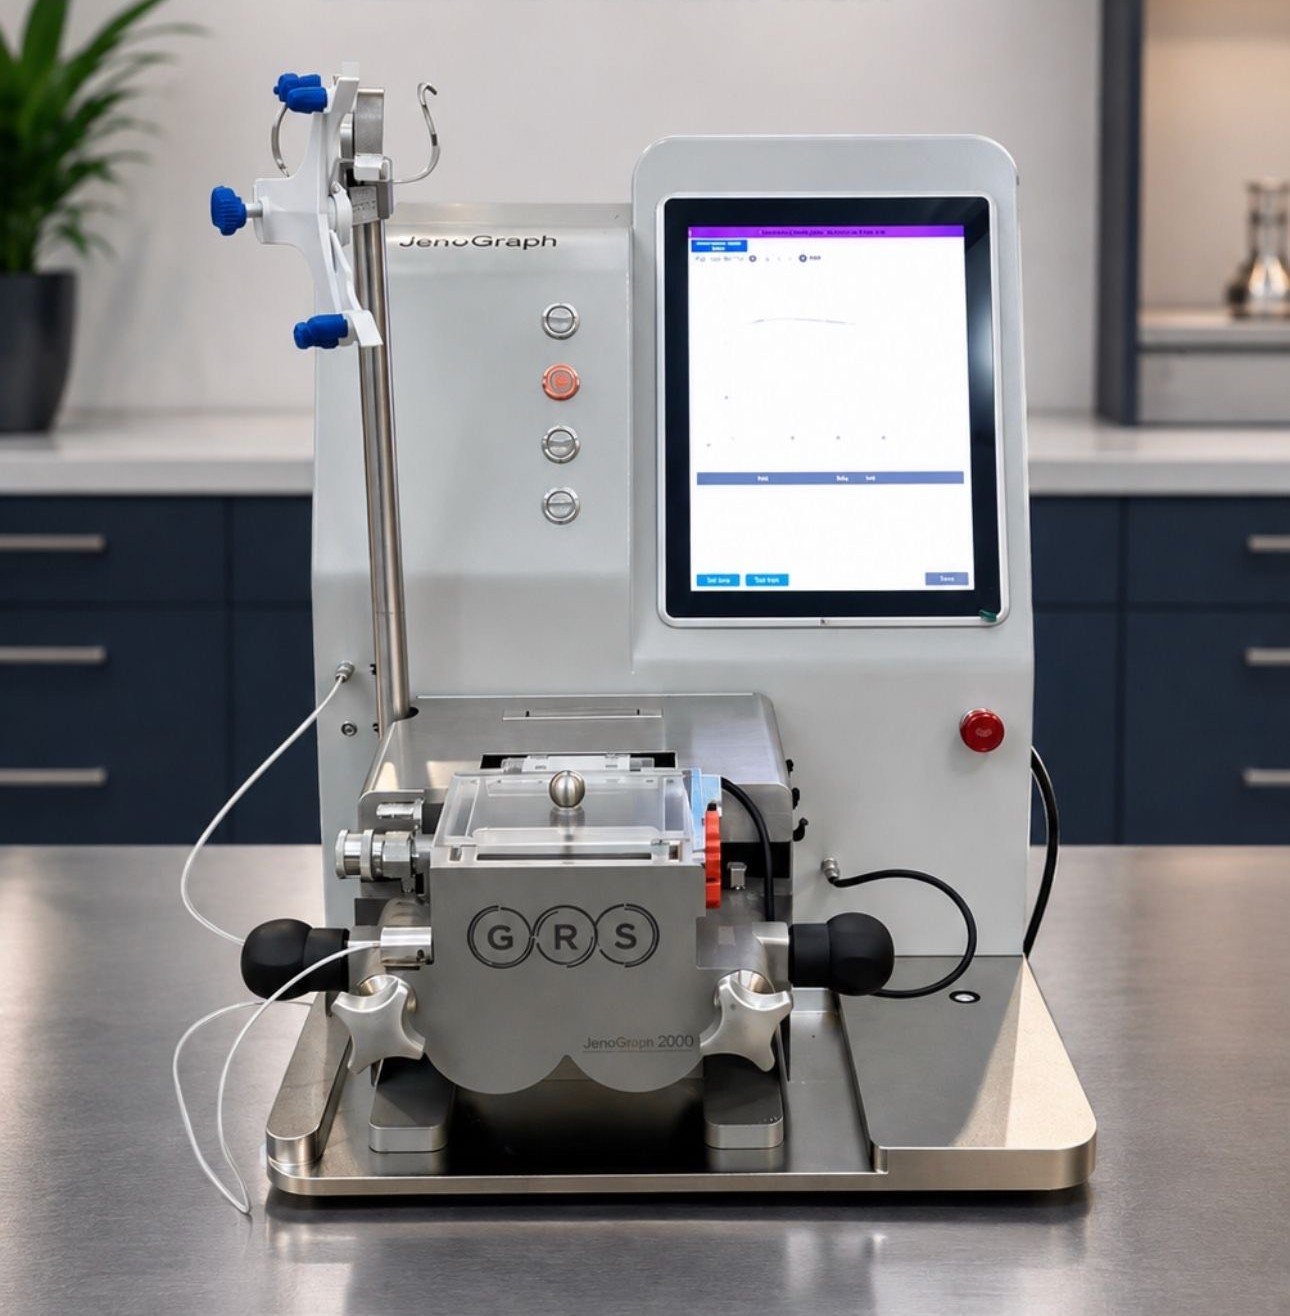
Measure flour water absorption and dough mixing behaviour with JenoGraph, the GRS flagship instrument for flour quality control and product development.
Enquire about JenoGraph↗Download JenoGraph brochure (PDF, 3 pages) ↗
Brochure & conference poster ↗
BUILT AROUND YOUR APPLICATION
A closer look at
flour & dough.
JenoGraph is a laboratory instrument for flour and dough quality-control work. Its software supports method setup, mixing-curve review and test reports that bring sample information and evaluated parameters together.
- Set up mixer, evaluation and premixing settings for your method.
- Review dough consistency during mixing and evaluation markers.
- Keep sample details and test conditions with the reported results.
Find the right configuration
The specifications below describe the 300 g configuration in the supplied GRS brochure. Confirm the exact instrument configuration, electrical requirements and applicable test methods with GRS before ordering.
FROM THE CONFERENCE POSTER
JenoGraph results compared
with the reference instrument.
The JenoGraph conference poster compares our instrument’s results with those of the reference instrument across 42 flour samples.
A broad flour sample set
The poster reports independent testing at the Australian Grain Technologies Quality Laboratory using the method labelled ICC BIPEA 300. The 42-sample set included commercial flours, specialty soft wheats and high-fibre formulations, with water absorption ranging from 46–80%.
| Parameter | Correlation |
|---|---|
| Water absorption (WAC) | 0.99 |
| Dough development time (DDT) | 0.92 |
| Stability | 0.81 |
The poster also reports water-absorption repeatability with a relative standard deviation (RSD) below 1%.
Source: “Introducing the JenoGraph” conference poster. These results describe the reported sample set and test conditions.
View the conference poster (JPEG) ↗JENOGRAPH SOFTWARE
From test setup
to a clearer result.
Set up your method, review mixing curves and keep the test conditions alongside your results.
SEE THE MIXING BEHAVIOUR
Follow the curve.
Review the evaluation.
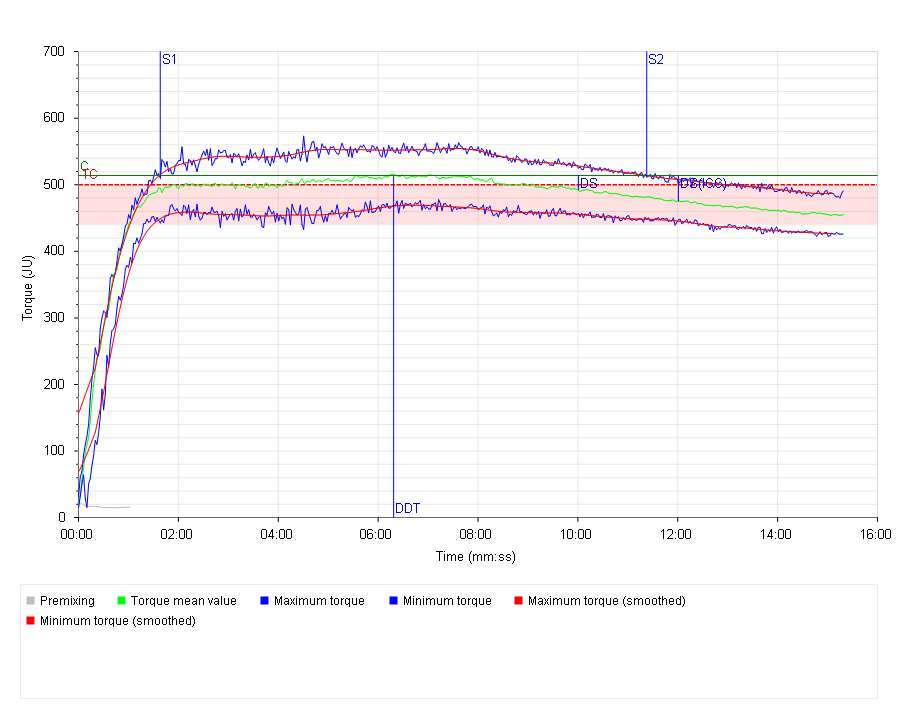
Follow dough resistance to mixing over time, with minimum, maximum and mean curves and markers for the selected evaluation. The example retains the software label Torque (JU).
JenoGraph reports bring sample information, test settings, the curve and evaluated parameters together for review.
Illustrative sample result. Results depend on the sample, method and instrument configuration.
PREPARE YOUR METHOD
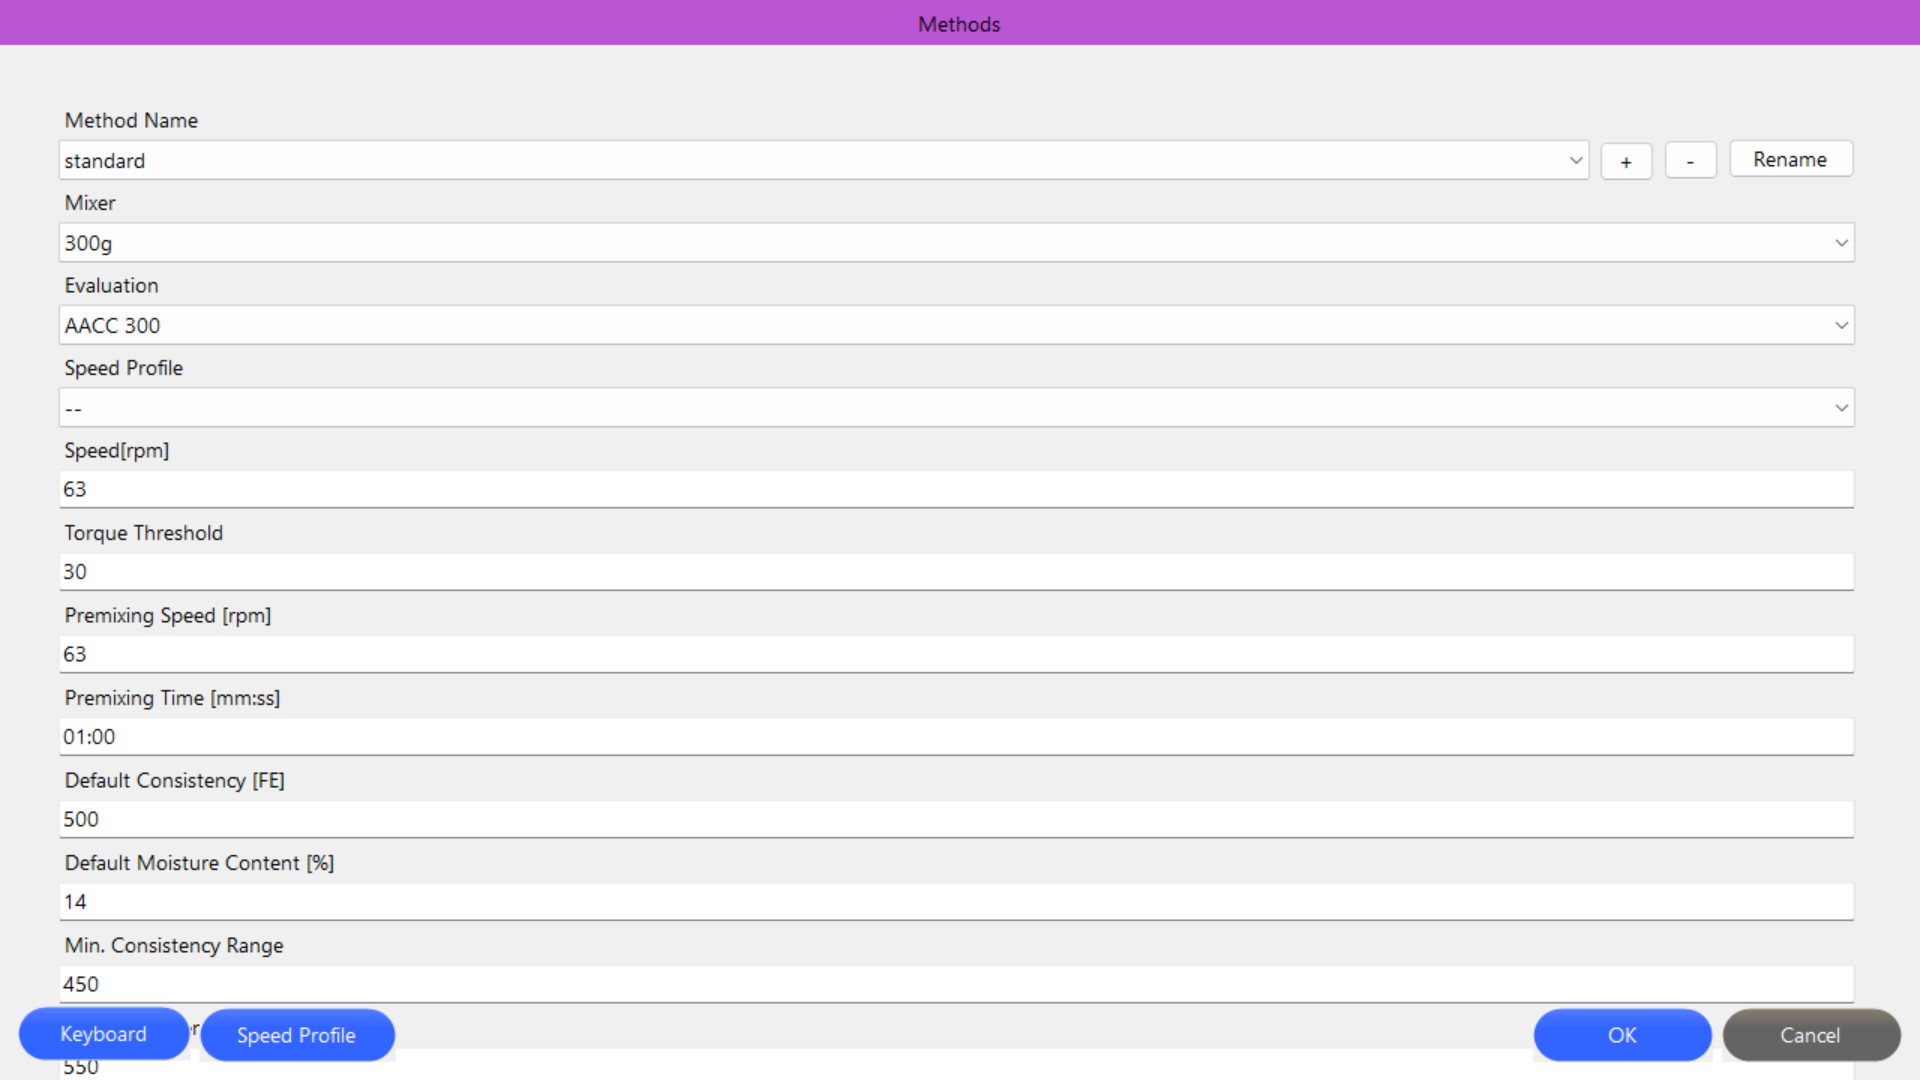
Keep the setup in view.
The Methods screen groups mixer and evaluation selection with speed, premixing time, target consistency and moisture settings.
Discuss your software and method requirements ↗JENOGRAPH AT A GLANCE
Technical specifications
The 300 g configuration described in the GRS product brochure.
| Mixer capacity | 300 g, sigma blades |
|---|---|
| Mixer blade speed | 63 min⁻¹ |
| Torque | Up to 20 Nm |
| Dimensions (L × W × H) | 790 × 465 × 600 mm |
| Weight | 40 kg |
| Interfaces | USB, HDMI and Wi-Fi |
Evaluated parameters
The brochure lists flour water absorption, dough development time (DDT), dough stability (S), degree of softening (DS), mixing tolerance index (MTI) and farinograph quality number (FQN). The available results depend on the selected evaluation.
Confirm the available evaluations, units and test methods for your configuration with GRS.
- Dough consistency
- Resistance to mixing under specified test conditions, measured through torque.
- Flour water absorption
- The water required to reach the specified dough consistency, expressed on the moisture basis prescribed by the method. Water added and corrected water absorption are distinct report values.
- Dough development time (DDT)
- Time from water addition until the dough reaches maximum consistency, as defined by the selected method.
- Dough stability (S)
- The interval between arrival and departure of the upper curve at the method-defined reference consistency.
- Degree of softening (DS)
- The decrease in consistency over the interval specified by the evaluation. The ICC evaluation uses 12 minutes after dough development time; a value taken 10 minutes after test start is a different evaluation.
The example uses JU as displayed by the JenoGraph software. Equivalence to Farinograph Units (FU) or Brabender Units (BU) requires confirmation for the instrument and method.
View the full GRS brochure (PDF, 3 pages) ↗TAKE A CLOSER LOOK
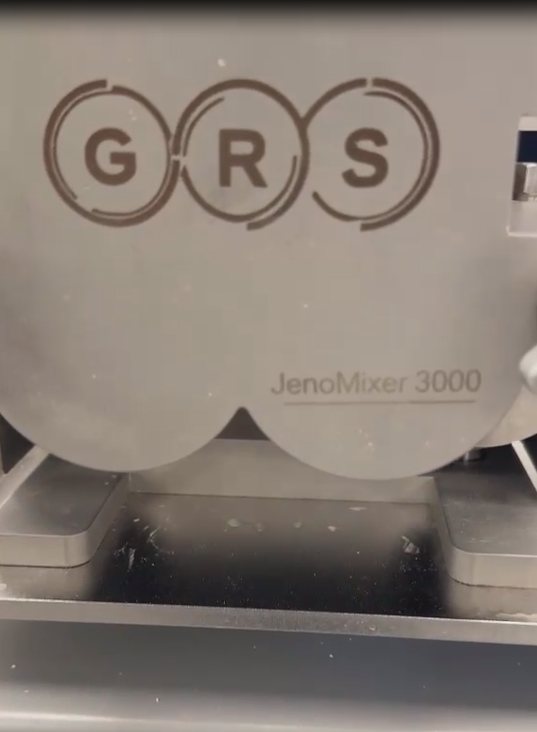
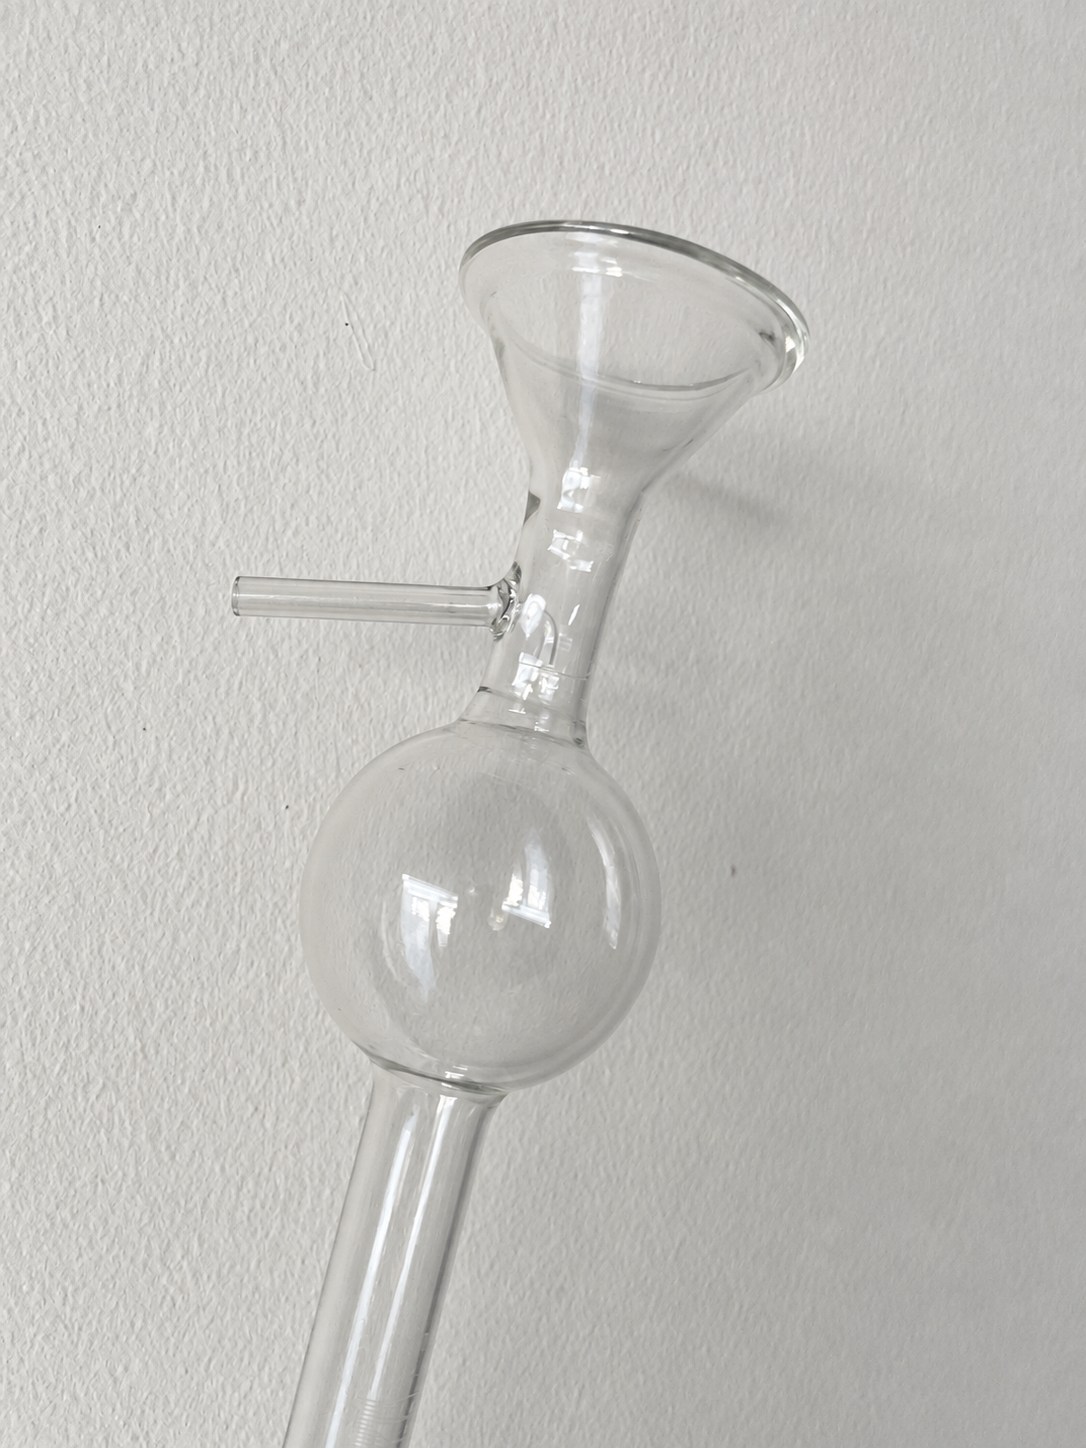
Details that support
your daily work.
JENOGRAPH RESOURCES
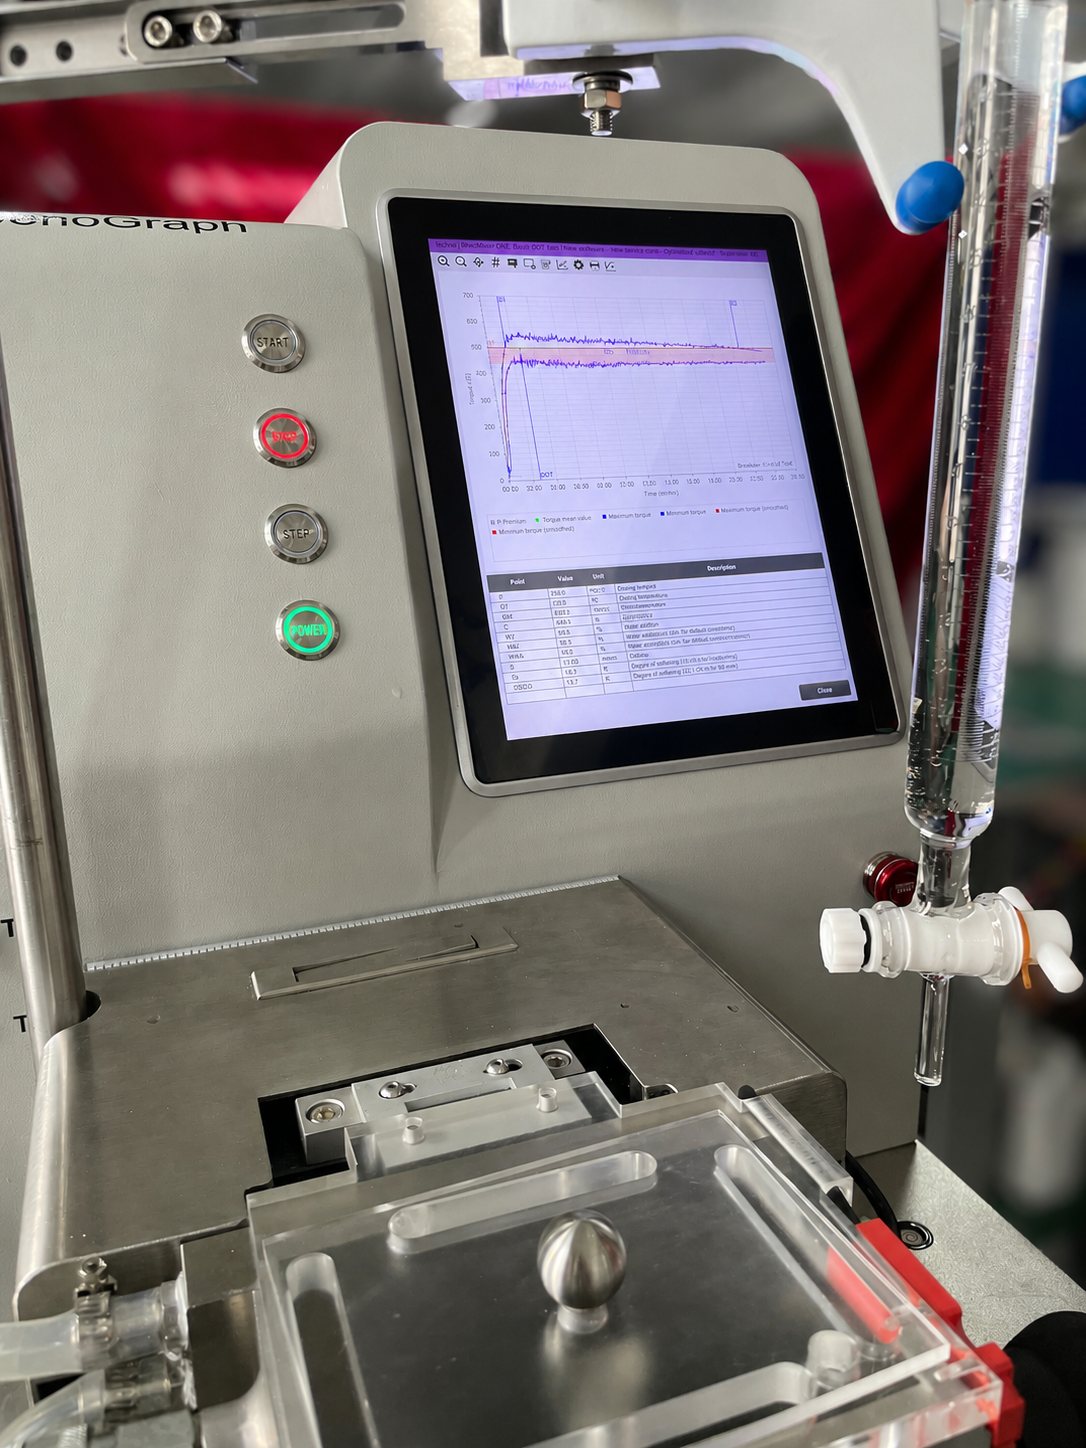
Brochure & conference poster
Explore JenoGraph specifications and the comparison with the reference instrument in the original documents.
JenoGraph brochure
Instrument features, evaluated parameters and specifications for the 300 g configuration.
Open brochureJPEG · CONFERENCE POSTERIntroducing the JenoGraph
Reported comparison results across 42 flour samples, including water absorption, development time and stability.
Open posterLET’S TALK ABOUT YOUR LABORATORY
What do you need
to measure?
Tell us about your material, instrument or next project. We’ll help you explore the options.
Talk with GRS